

d3:9b scores 85.2 on our benchmark, just 1.1 points behind d3:27b. Its median latency is 303 ms rather than 870 ms, and peak VRAM is 11.2 GB rather than 30.7 GB. For an application that continuously classifies or routes requests, those trade-offs deserve a look before reaching for the largest model.
We compared 14 local decision-model variants served through Ollama with Jev 1.14.0, TypeSafe's paid API, across eight tasks covering logs, English classification, Vietnamese and yes/no questions. Each model received the same state and questions for each of 1,600 decisions.
pplx-decider:27b has the highest observed aggregate, 86.6. Jev scores 82.7, eighth among the 15 tested configurations. But one run with 200 examples per task cannot turn small gaps into reliable victories. The more useful question is what each option trades in quality, latency, memory and operational effort.
Which model should you try first?
Have a GPU and want a balanced starting point: try
d3:9b.Prioritize aggregate quality and have a large GPU: shortlist
pplx-decider:27bandd3:27b.No GPU, or less infrastructure to operate: Jev remains a reasonable candidate.
English intent routing and review scoring: look at
clef-flash:9b.Vietnamese input: test on your own data; English scores are not enough.
These are the author's personal picks within this benchmark's scope.
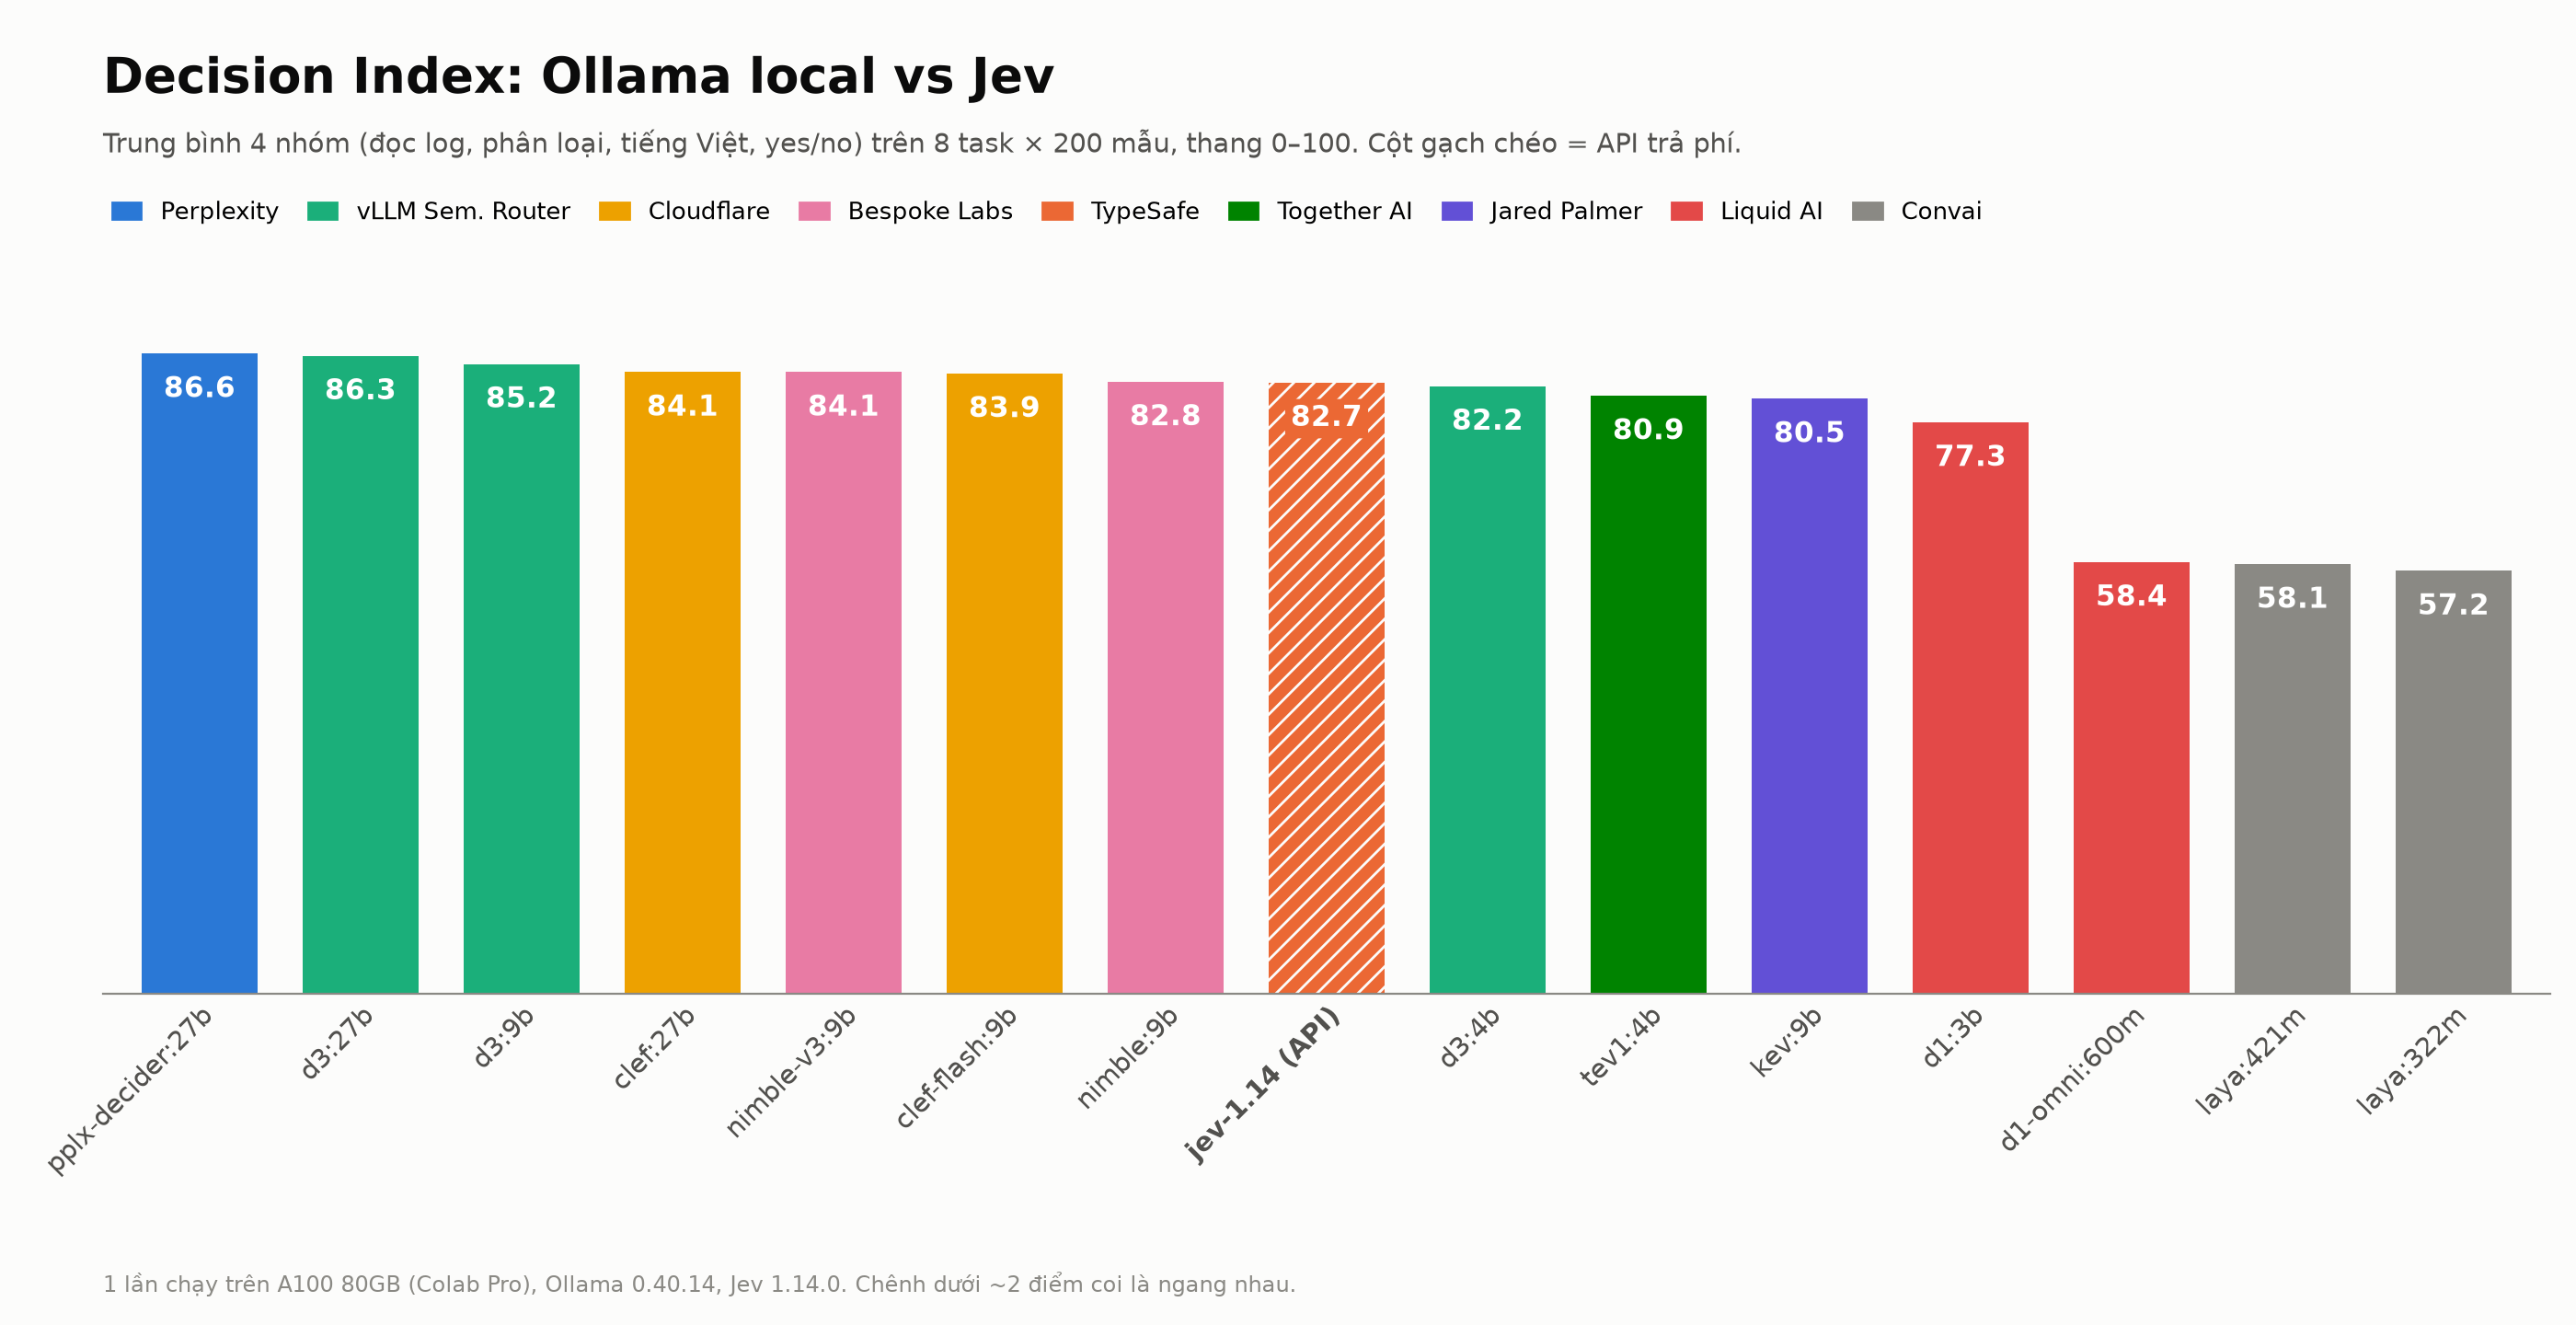
Figure 1. Decision Index on a 0–100 scale; the hatched bar is Jev. About two points is the report's cautious reading convention, not a tested threshold for statistical significance. Original figure labels are in Vietnamese.
Key results
- 9B is a useful balance to test.
d3:9bscores 85.2 with a 303 ms p50 and 11.2 GB peak VRAM. Moving to the 27B member of the same family adds only 1.1 observed points. - Seven local configurations score above Jev. The gaps range from tiny to a few points.
nimble:9b, for example, scores 82.8 against Jev's 82.7; that is not evidence of a clear win. - Vietnamese separates models sharply.
d1-omni:600mandlaya:421mremain useful on some English tasks but drop substantially on the two Vietnamese tasks. - Good ranking does not guarantee good classification at the default threshold. On BGL, Jev and
clef:27bhave high AUROC but lower macro-F1 than several alternatives. - The paid API can be inexpensive. Jev costs an estimated USD 0.0207 per 1,000 decisions at this suite's input lengths. Existing infrastructure and data-locality requirements may matter more than the small cost differences.
What is a decision model?
An application often needs a specific judgment: which category a request belongs to, whether a log is an alert, or which rating fits a review. With a decision model, the application supplies a state and typed questions, then receives structured answers and probabilities rather than asking for a free-form explanation and parsing it afterward.
The benchmark uses choice for labels, noul for the probability of a yes answer, and score for ordered rubric levels. TypeSafe documents these outputs in its System One introduction.
Ollama exposes the compatible /v1/systemone endpoint. We kept the state and questions identical for each example, changing the endpoint, model selector and authentication configuration for the backend. This reduces differences in API usage; it does not remove differences in checkpoints, quantization, runtimes or infrastructure.
How we tested
| Component | Configuration |
|---|---|
| Local hardware | Google Colab Pro, NVIDIA A100 80 GB, High-RAM |
| Software | Ollama 0.40.14 |
| API comparison | Jev jev-1.14.0, called from the same Colab machine |
| Examples | 8 tasks × 200 examples = 1,600 decisions per model |
| Sampling | Fixed seed 2026 |
| Concurrency | 4 simultaneous requests for local models and Jev |
| Input | State capped at 2,000 characters; instructions and label descriptions in English |
| Valid responses | 100% for models that successfully ran |
The last row describes response validity under the benchmark's checks, not correctness on every example.
| Group | Tasks | Data | Metric |
|---|---|---|---|
| Logs | BGL alerts, balanced 100/100; masked log-level prediction; source identification across 16 systems | LogHub | Macro-F1 |
| Classification | English intent across 18 domains; five-level review scoring | MASSIVE en-US; Yelp Review Full | Macro-F1; 1 − MAE/4 |
| Vietnamese | Intent across 18 domains; balanced three-label student-feedback sentiment | MASSIVE vi-VN; UIT-VSFC | Macro-F1 |
| Yes/no | Questions answered from a passage | BoolQ | Macro-F1 |
Each group averages its constituent tasks. Decision Index is the unweighted mean of the four groups, scaled to 0–100. BoolQ therefore carries 25% of the aggregate despite being one task. This is RTIC's aggregate for this suite, not an accuracy percentage or the publisher's separately defined Decision Index.
Overall results: a closely spaced leading group
| Model | Decision Index | Logs | Classification | Vietnamese | Yes/no |
|---|---|---|---|---|---|
| pplx-decider:27b | 86.6 | 80.1 | 90.6 | 82.3 | 93.3 |
| d3:27b | 86.3 | 83.1 | 88.8 | 79.9 | 93.3 |
| d3:9b | 85.2 | 78.1 | 88.3 | 80.2 | 94.3 |
| clef:27b | 84.1 | 70.7 | 90.8 | 80.6 | 94.3 |
| nimble-v3:9b | 84.1 | 82.6 | 87.8 | 74.7 | 91.3 |
| clef-flash:9b | 83.9 | 72.4 | 92.2 | 80.4 | 90.8 |
| nimble:9b | 82.8 | 79.3 | 89.3 | 73.5 | 89.2 |
| Jev 1.14 (API) | 82.7 | 72.0 | 88.3 | 79.4 | 91.2 |
| d3:4b | 82.2 | 68.9 | 88.2 | 79.3 | 92.3 |
| tev1:4b | 80.9 | 72.9 | 87.0 | 76.0 | 87.8 |
| kev:9b | 80.5 | 69.2 | 87.6 | 76.3 | 89.2 |
| d1:3b | 77.3 | 65.6 | 88.5 | 68.2 | 86.7 |
| d1-omni:600m | 58.4 | 56.7 | 85.9 | 20.7 | 70.3 |
| laya:421m | 58.1 | 61.6 | 68.8 | 21.9 | 80.0 |
| laya:322m | 57.2 | 42.8 | 63.8 | 56.8 | 65.3 |
The d3 family moves from 82.2 → 85.2 → 86.3 as size grows from 4B to 9B to 27B. The last step uses more memory and adds latency for a smaller score gain than the preceding step. If 27B is your default simply because it is larger, give 9B a trial first.
Closely spaced ranks describe this particular run. We have neither confidence intervals nor statistical tests establishing stable superiority or equivalence.

Figure 2. Original per-task figure; bold cells mark the highest values before display rounding. The left aggregate bars use 0–1, corresponding to the table's 0–100 Decision Index. Original figure labels are in Vietnamese.
Vietnamese: English performance does not settle the choice
d1-omni:600m scores 0.833 on English intent but 0.176 on Vietnamese intent and 0.238 on Vietnamese sentiment. For laya:421m, the Vietnamese scores are 0.175 and 0.264.
The multilingual laya:322m improves those tasks to 0.506 and 0.629, but scores below laya:421m on every other task in this suite. Neither small size nor a multilingual label predicts the outcome of a particular application.
The leading Vietnamese group scores are pplx-decider:27b 82.3, clef:27b 80.6, clef-flash:9b 80.4 and d3:9b 80.2. Jev's 79.4 remains close. On sentiment alone, tev1:4b has the highest macro-F1, 0.794: leading a group does not mean leading every task within it.
MASSIVE vi-VN is translated data, while UIT-VSFC contains student feedback. A Vietnamese product still needs examples reflecting its own terminology, proper names and users' phrasing.
Classification favors clef-flash; logs tell another story
clef-flash:9b leads the classification group at 92.2, with the highest scores on English intent (0.927) and Yelp (0.916).
Logs favor d3:27b (83.1) and nimble-v3:9b (82.6), against Jev's 72.0. Yet macro-F1 alone leaves out an important part of the BGL result.
| Model | BGL macro-F1 | BGL AUROC | BGL Brier |
|---|---|---|---|
| d3:27b | 0.873 | 0.989 | 0.108 |
| d3:9b | 0.914 | 0.967 | 0.097 |
| clef:27b | 0.571 | 0.982 | 0.224 |
| Jev 1.14 (API) | 0.643 | 0.975 | 0.176 |
Jev and clef:27b rank BGL examples well by AUROC despite lower macro-F1 at the default 0.5 threshold. That is a reason to inspect threshold curves and probability quality before excluding a model from an alerting pipeline.
Lower Brier is better, but Brier is not a calibration-only measure. It also depends on discrimination; AUROC and Brier alone do not fully diagnose the cause of the errors. Scikit-learn's calibration guide explains this distinction.
On BoolQ, d3:9b and d3:27b both have Brier 0.043, the lowest for that task in the supplied probability table. This is worth considering when an application uses probabilities directly in its decision logic.
The brief also records examples containing FATAL whose BGL labels are normal. Severity words and the dataset's anomaly labels should not be treated as interchangeable. A sensible next step is threshold selection on a separate validation set, followed by evaluation on held-out test data. This benchmark does not report the improvement after threshold tuning.
Latency, memory and cost: local has a bill too
Latency is measured at the client with four concurrent requests. Jev includes the network journey from Colab to the API. The A100 runs the local models; it is not a confirmed description of Jev's serving hardware.
| Model | p50 (ms) | p95 (ms) | Peak VRAM (GB) | USD/1,000 decisions |
|---|---|---|---|---|
| pplx-decider:27b | 867 | 1,155 | 19.9 | 0.0531 |
| d3:27b | 870 | 1,152 | 30.7 | 0.0532 |
| d3:9b | 303 | 400 | 11.2 | 0.0186 |
| clef:27b | 1,031 | 1,629 | 32.2 | 0.0714 |
| nimble-v3:9b | 214 | 352 | 17.3 | 0.0153 |
| clef-flash:9b | 373 | 556 | 13.4 | 0.0253 |
| nimble:9b | 212 | 350 | 16.5 | 0.0152 |
| Jev 1.14 (API) | 217 | 259 | — | 0.0207 |
| d3:4b | 203 | 258 | 7.0 | 0.0124 |
| tev1:4b | 147 | 289 | 9.5 | 0.0203 |
| kev:9b | 195 | 281 | 18.9 | 0.0122 |
| d1:3b | 101 | 124 | 4.3 | 0.0060 |
| d1-omni:600m | 34 | 48 | 3.8 | 0.0045 |
| laya:421m | 43 | 52 | 1.2 | 0.0027 |
| laya:322m | 35 | 41 | 1.2 | 0.0022 |
Jev has a 217 ms p50 and 259 ms p95 including the network, while the local 27B models have p95 values of 1,152–1,629 ms. Several small local models are faster still; these results do not establish the API as the lowest-latency option overall.
The author estimates local cost from measured runtime and an A100 Colab Pro rate of approximately USD 0.89/hour, excluding model downloads and idle GPU time. That is not the total cost of owning or operating a local service.
Jev charges USD 0.042 per million input tokens, with free output tokens, according to TypeSafe's model table. This run used approximately 790,000 input tokens across 1,600 requests, costing about USD 0.033, or USD 0.0207 per 1,000 decisions. Per-decision cost changes with state and question lengths.
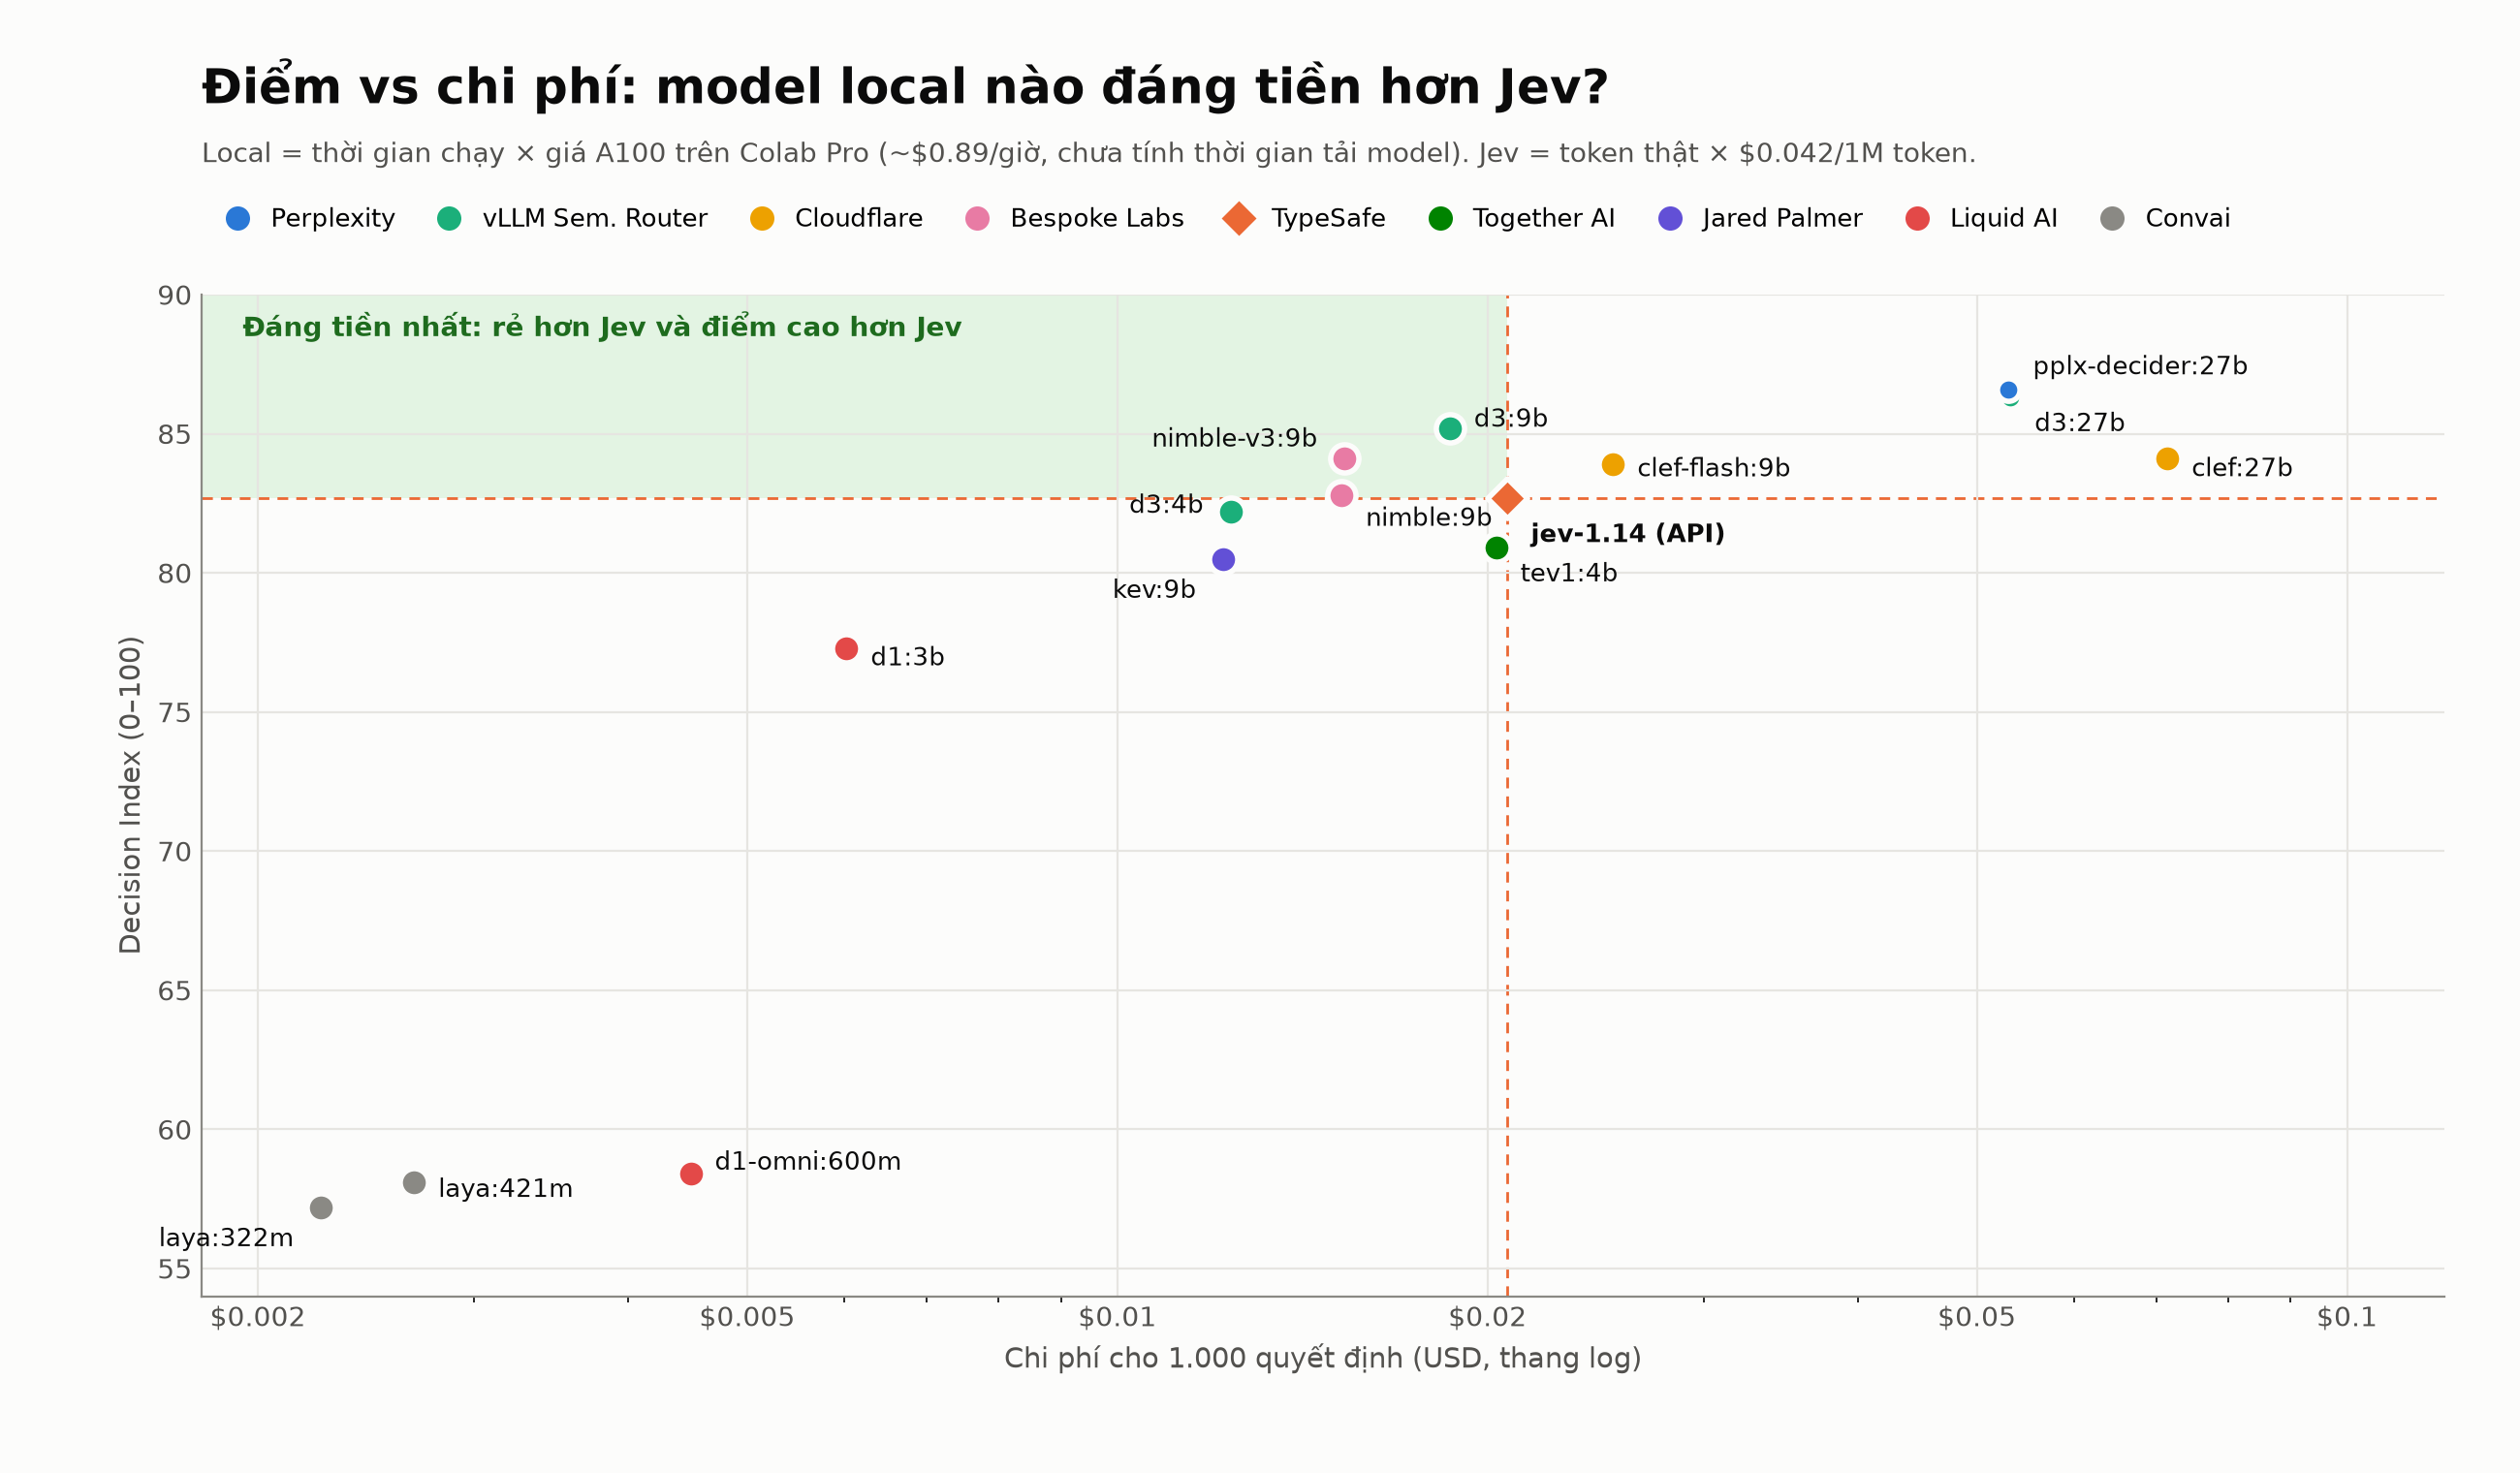
Figure 3. d3:9b, nimble-v3:9b and nimble:9b have higher observed scores and lower estimated costs than Jev in this setup. Cost is on a logarithmic axis. The shaded region does not establish statistically significant superiority. Original labels are in Vietnamese.
At similar input lengths, one million Jev decisions are estimated at about USD 21. When choosing a backend, also ask whether a GPU is already available, whether data may leave the system, whether offline operation matters and who will maintain the service. Downloadable weights still need compute resources.
Author's picks by use case
| Need | Candidates to test | Evidence within this suite |
|---|---|---|
| Balance quality, latency and memory | d3:9b | 85.2 points; 303 ms p50; 11.2 GB peak VRAM |
| Prioritize aggregate score with a large GPU | pplx-decider:27b; d3:27b | Highest observed aggregates, 86.6 and 86.3 |
| Avoid operating a GPU service | Jev 1.14 API | 82.7 points; 259 ms p95; low input cost in this run |
| Read and classify logs | d3:27b; also try d3:9b | Strong log results; thresholds still need local validation |
| English intent and review scoring | clef-flash:9b | Leads classification at 92.2 |
| Vietnamese content | pplx-decider:27b; also try clef:27b, d3:9b | Among the stronger Vietnamese group results |
| Limited resources | d1:3b; also try d3:4b | d1:3b scores 77.3 with 4.3 GB peak VRAM |
VRAM values are measurements under the tested setup, not guaranteed minimum requirements for every deployment. Check the exact release's license as well: nimble-v3 is published under CC BY-NC 4.0, unlike the earlier Apache 2.0 nimble release.
Limitations
- One run, 200 examples per task, no confidence intervals. About two Index points is a cautious reading convention, not proof of statistical difference or equivalence.
- Different weight formats.
pplx-decideruses q4_K_M; d3, clef, clef-flash and d1 use q8_0; nimble, nimble-v3, kev, tev1 and d1-omni use the recorded bf16 tags. This compares serving configurations rather than isolating quantization effects. - Instructions and label descriptions are English, including for Vietnamese state text. Other prompt languages may change results.
- State is capped at 2,000 characters. The suite does not evaluate the models' long-context capabilities.
- Eight tasks do not cover every application. Translated text, student feedback and BGL labels have specific characteristics. There are no image or audio tasks.
- Latency depends on environment and concurrency. Local uses one A100; Jev includes network and API infrastructure. These measurements do not establish throughput or cost under other loads.
- Local cost excludes downloads, idle GPU time and operations. Estimates use the price assumptions and token volumes of the 3 November 2026 run.
- Some intended configurations did not run on this A100 setup.
strands-decider,kev:27b,d1-omni:2band the intended 8-bitpplx-decidertag are absent from the ranking. This is a limitation of the tested packages/backends, not a claim that NVFP4 or MXFP8 formats are inherently Mac-only.
Applying the results
Start with candidates matching your resources, such as d3:9b when a GPU is already available or Jev when an API is preferable. Test on the application's own data, keep an independent test set, inspect probabilities and decision thresholds, then measure latency, memory and cost at the expected load.
A high aggregate can still hide the failure that matters most to a product. The benchmark is most useful when it tells us what to try next and what else to measure.
Sources and reproducibility
Download the benchmark data appendix (PDF, 6 pages)
All measured results come from Hồ Việt Anh's RTIC benchmark brief for 3 November 2026. The benchmark was not rerun during article preparation. The author identifies the notebook as decision_benchmark_colab.ipynb; exact tested tags and the complete supplied result tables are preserved in the accompanying data appendix.
- LogHub
- MASSIVE en-US, SetFit version and MASSIVE vi-VN, SetFit version
- Yelp Review Full
- UIT Vietnamese Students Feedback
- BoolQ
- Ollama System One API and TypeSafe Jev models/pricing
- Previous RTIC article: benchmarking 17 Ollama embedding models
Continue reading
RTIC / Journal
Discussion & feedback
Ask a question, share evidence, or help improve this article.
Sign in with RTIC GitLab to comment or mark a contribution helpful. Member sign in →

oh mai gotto